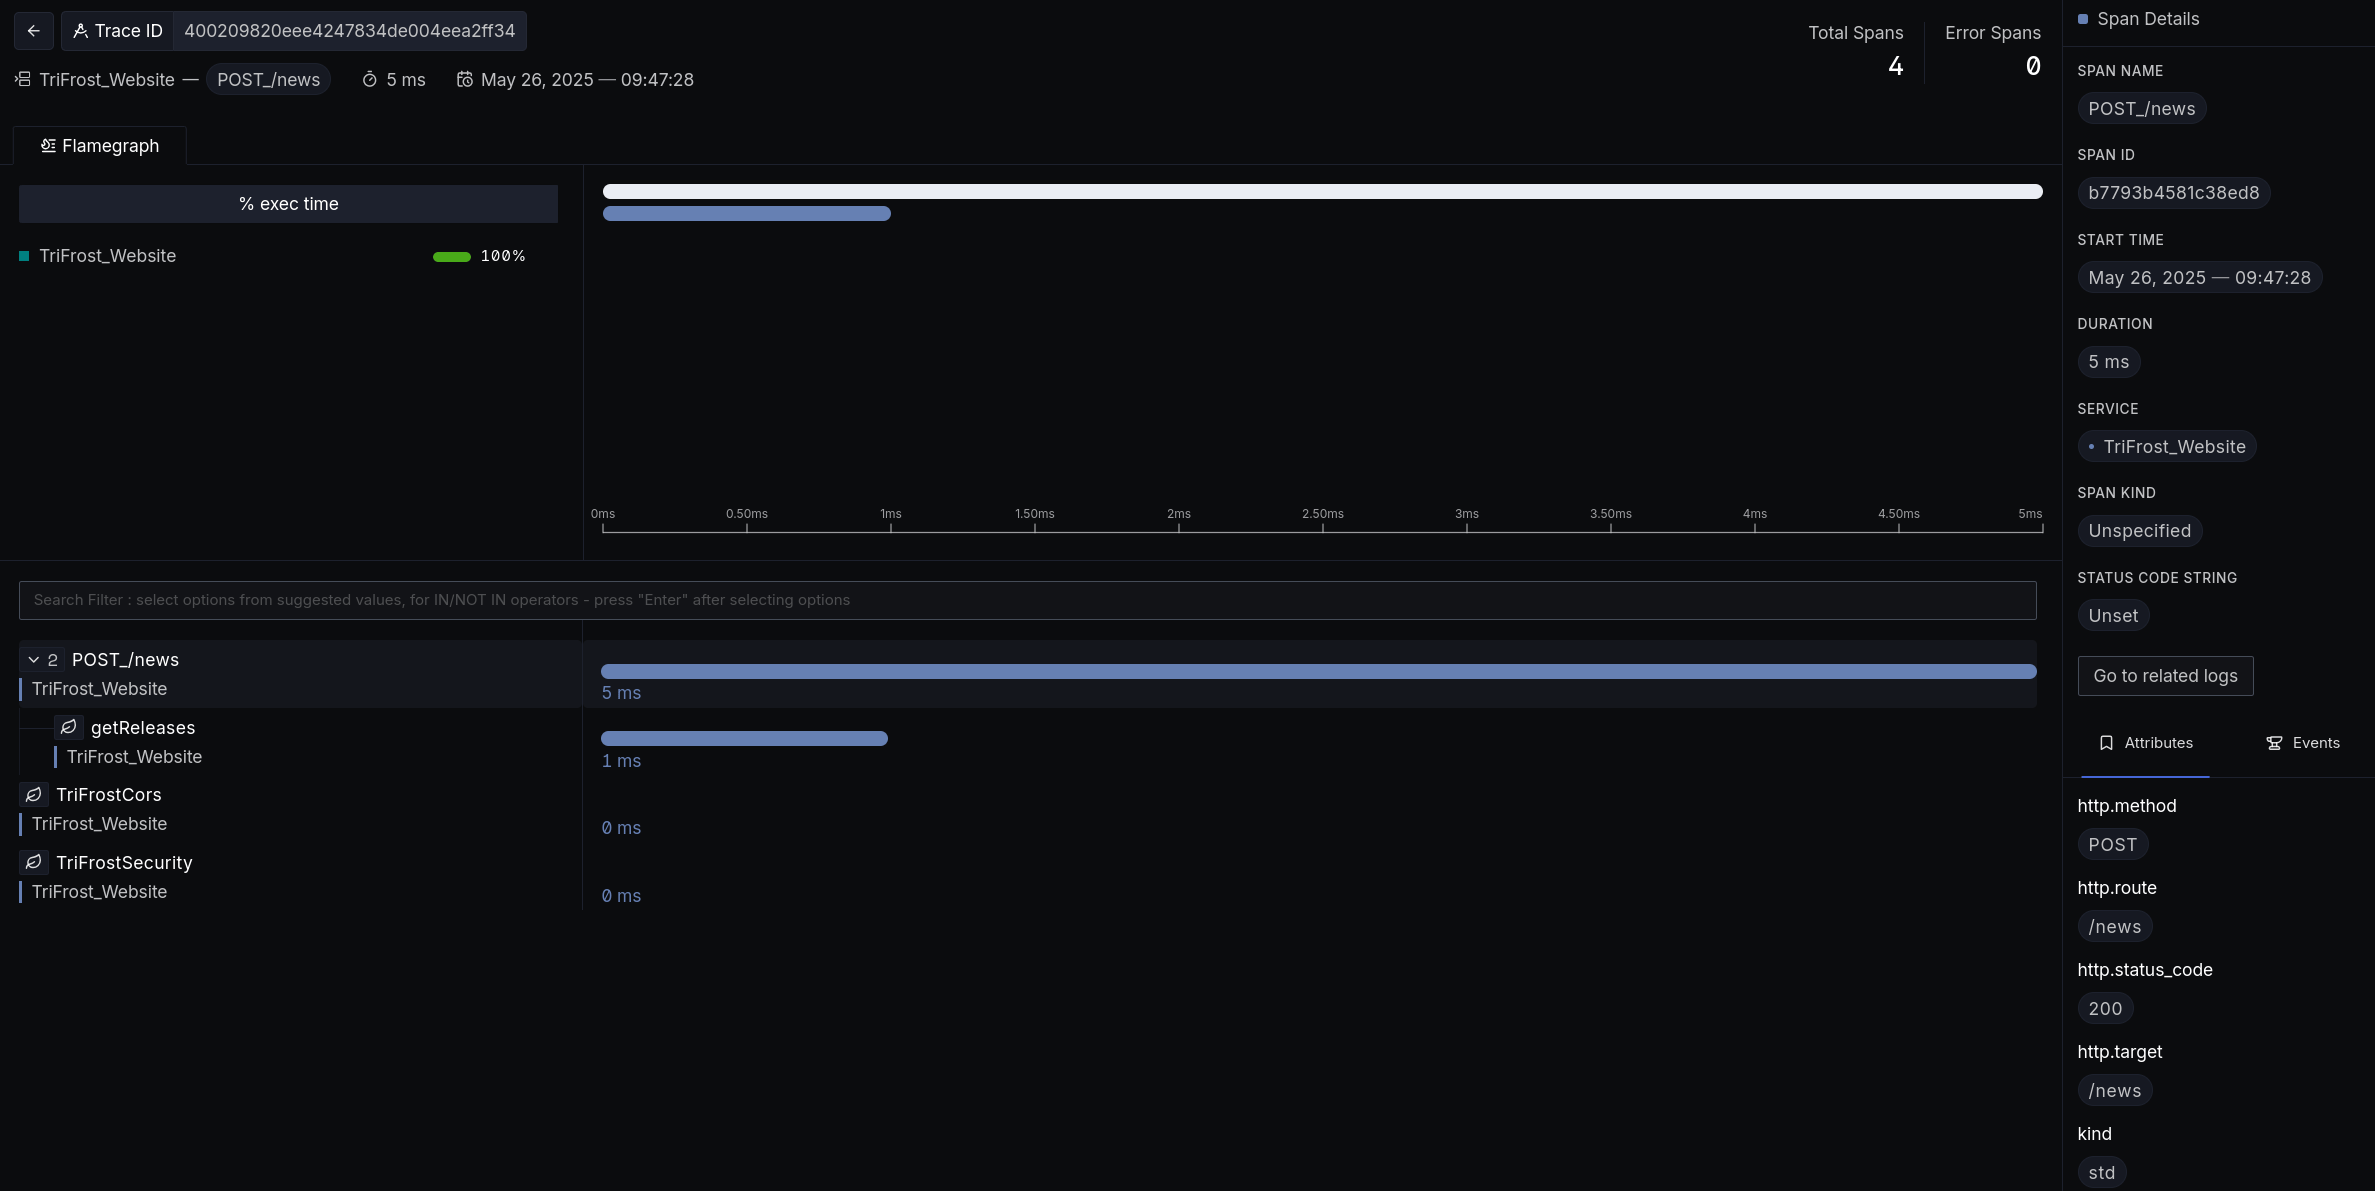
Logger
TriFrost’s logging system lives on ctx.logger — your built-in toolkit for structured, leveled, context-aware logs and spans.
No setup required: Every incoming request automatically gets its own logger, complete with a unique trace ID, span tracking, and all the core context and app metadata baked in.
Runs across all runtimes: Whether you’re on Node, Bun, or Workerd, TriFrost automatically wires up a runtime-specific exporter so your logs go somewhere — even if you didn’t configure one.
Think of it as a logbook that always knows which request you’re on, what span you’re in, and which attributes matter — ready for structured export.
✨ Note: Many deeper logging features (like distributed tracing, external collectors, or advanced exporters) are covered in the Logging & Observability article. Here, we focus purely on the
ctx.loggerAPI.
Before we continue
- Middleware is automatically spanned — you don’t need to manually wrap middleware in spans. TriFrost handles this for you.
- Logs and spans are flushed automatically after each request — no need to call
flush()unless you’re doing something like an explicit shutdown. - App metadata (name, version, meta) and context metadata (route, method, status, ...) are automatically attached as attributes on logs and spans.
- You can (and should) add custom attributes using
setAttribute()orsetAttributes()to enrich your traces. For example: internal identifiers are gold for analysis. - For method-level tracing, you can also use the
spandecorator orspanFn()utility — see below. - Logs are automatically redacted of sensitive information using a sensible default, to customize this all exporters support an omit option. Learn more about this here
🟡 Logging Debug Messages
ctx.logger.debug(message:string, data?:Record<string, unknown>):voidLogs a low-level debug message.
This is only emitted when your app was created with debug: true — perfect for noisy internal details you don’t want flooding production logs.
Example:
ctx.logger.debug('User lookup started', {userId: ctx.state.userId});🔵 Logging Info Messages
ctx.logger.info(message:string, data?:Record<string, unknown>):voidLogs an informational message — the backbone of your normal operational logs.
Example:
ctx.logger.info('Request completed', {
  path: ctx.path,
  statusCode: ctx.statusCode
});
⚠️ Logging Warnings
ctx.logger.warn(message:string, data?:Record<string, unknown>):voidLogs a warning — something non-fatal but worth your attention.
Example:
ctx.logger.warn('Deprecated API endpoint used', {path: ctx.path});🔥 Logging Errors
ctx.logger.error(error:Error|string|unknown, data?:Record<string, unknown>):voidLogs an error or exception.
If you pass an Error instance, the stack trace is automatically included.
Example:
try {
  await expensiveOperation();
} catch (err) {
  ctx.logger.error(err, {operation: 'expensiveOperation'});
}
📦 Spans
A span represents a single unit of work in your system — think of it like a timer wrapped around a specific operation.
For example:
- A span might cover "fetching user from database."
- Another span might wrap "rendering HTML response."
Together, spans form a tree of where time was spent inside a request.
Spans can also carry metadata (attributes) and are linked together by a shared trace ID, letting observability tools reconstruct the full picture of a request as it moves through your system.
In short: spans tell you what happened, when, and how long it took — across services, layers, and functions.


Decorator and Utility
Decorator: span()
import {span} from '@trifrost/core';

class MyService {
  @span()
  async process(ctx) {
    // Automatically traced as "process"
  }

  @span('customSpanName')
  async special(ctx) {
    // Traced as "customSpanName"
  }
}Utility: spanFn()
import {spanFn} from '@trifrost/core';

const process = spanFn('process', async (ctx) => {
  // Automatically wrapped in a span
});
Both are great for instrumenting services, utilities, or helpers where you want lightweight tracing without clutter.
Using ctx() in Decorators (v1.3)
From v1.3 onward, decorators and helpers automatically resolve the active request context using ctx() (backed by AsyncLocalStorage).
This means you don’t always need to pass ctx explicitly if your method doesn’t otherwise need it:
import {span, ctx} from '@trifrost/core';

class ProductService {
  // No ctx arg here — span key + method body both resolve context implicitly
  @span(() => `getProduct:${ctx().state.organisationId}`, {ttl: 120})
  async getProduct() {
    const id = ctx().state.productId;
		...
  }
}
✅ Best Practices:
- If your method already needs
ctx(e.g. to read body, query, headers), keep it as an argument. - If your method doesn’t need
ctxdirectly, lean onctx()for cleaner signatures. - Decorators (
@cache,@span) and wrappers (cacheFn,spanFn) will work in both styles.
logger.span (inline)
await ctx.logger.span<T>(name:string, fn:() => Promise<T>|T):Promise<T>Wraps a block of code in a named span, automatically tracking its start and end time, and sending it to span-aware exporters (like OTEL).
Example:
await ctx.logger.span('loadUserProfile', async () => {
  const user = await loadUser(ctx.state.userId);
  ctx.setState({user});
});
Manually Start/End Spans
const span = ctx.logger.startSpan(name:string);
span.setAttribute(key, value);
span.setAttributes({...});
span.end();
Manually start a span you control — useful when you need to track something over time or across multiple function calls.
Example:
const span = ctx.logger.startSpan('manualProcessing');
span.setAttribute('step', 'start');

await phaseOne();
span.setAttribute('step', 'phaseOneCompleted');

await phaseTwo();
span.end();
🧩 Setting Context Attributes
ctx.logger.setAttribute(key:string, value:unknown):this
ctx.logger.setAttributes(attrs:Record<string, unknown>):this
Attach persistent context attributes to the logger — these will appear on all subsequent logs and spans.
Spans inherit all context-level attributes at the moment they are created. If you add attributes after starting a span, they won’t retroactively apply to it — set important attributes early.
These attributes apply only for the lifespan of the current ctx.logger (i.e., the current request); they do not persist globally or across requests.
Example:
ctx.logger.setAttributes({
  userId: ctx.state.user.id,
  tenantId: ctx.state.tenant.id
});
ctx.logger.info('User session updated');
📤 Flushing Logs and Spans
await ctx.logger.flush():Promise<void>Forces all buffered logs and spans to be pushed to the configured exporters — especially useful when shutting down or doing edge returns.
Example:
await ctx.logger.flush();
return ctx.text('Shutting down gracefully');
🚚 Exporters
TriFrost ships with:
- ConsoleExporter
Structured logs toconsolewith grouping and formatting, ideal for local dev and CI runs. - JsonExporter
>Emits NDJSON-formatted logs toconsoleor custom sink, ideal for File-based logs, piping. - OtelHttpExporter
>Sends logs + spans to an OTLP-compatible backend, ideal for production observability
Exporters are configured once when creating your App instance (see tracing.exporters in the App config). You can combine multiple exporters to target both local logs and external collectors.
✨ Note: If no exporter is configured each runtime will instantiate their default exporter. Node.js/Bun use
ConsoleExporterand Workerd usesJsonExporter
For more details, see:
Best Practices
- ✅ Use static message strings with structured data (instead of fully dynamic messages) — this improves how observability systems group and index logs.
- ✅ Use spans to track durations for important operations — especially when you care about performance or tracing.
- ✅ Add custom attributes (like
userId,tenantId, etc.) to enrich your traces. - ✅ You almost never need to call
flush()manually — TriFrost handles it at the end of the request. Tip: Only callflush()if you need immediate delivery (for example, before an early exit or when doing non-standard asynchronous work outside the request lifecycle). - ✅ Middleware is already spanned by the framework — don’t wrap middleware manually.